Asset allocation (simply the mix of investment types that you hold) is the most important factor affecting the level of risk and likely return that you might achieve when investing over the long term. If you hold most of your money in cash then your chance of losing money is low, but returns will also be low and might not keep pace with inflation. If you invested most of your money in stocks and shares then the chances of a greater return are higher over the longer term, but the chances of suffering losses in the short term are also higher.
The following chart represents a study* conducted in 1991 to establish where the variability of
investment returns come from.
A further study** indicated that for the long term individual investor, who maintains a consistent asset allocation and leans towards index funds, asset allocation determines close to 100 % of performance.
The mix of investment types you hold is the most important factor that affects the level of risk and return you may get, but how do you decide what assets to invest in? Our research indicates that the most reliable method is to look at long term trends for different investment asset classes and then identify how capital markets reward the different levels of risk taken and how these returns are correlated. We then built diversified portfolios based on the following principles we believe in.
Active fund managers try to beat the market through the selection of the investments they hold and timing their entry into and exit from the market. However, the efficient market hypotheses suggests that markets are efficient as they reflect all available information and therefore the market price is what people are prepared to pay at that time.
Prices change due to unforeseen events or market momentum; however, any miss-pricings are not in predictable patterns that can lead to consistent outperformance.
Active stock selection can lead to greater risk and volatility to the market. In addition, this generally leads to significantly higher costs in order to pay for the active management. An active manager will argue that they offer the potential to beat the market, whilst just tracking a market through some type of index tracker will only follow the market.
However, most active managers fail to beat the market average; partly down to their costs and partly down to the difficulties in trying to predict future events. Some active managers do beat the market over certain timeframes when their selections come good; however, our research demonstrates that few of these managers repeat that performance over time.
Before costs, the market return is a zero sum game meaning that for every investor who beats the market average, another investor had to underperform the market. Everyone cannot beat the market, as they are the market. Returns can be random and difficult to predict consistently.
Therefore, our research indicates where possible, the most efficient and lower risk approach is to accept market returns using index trackers at the minimum possible cost.
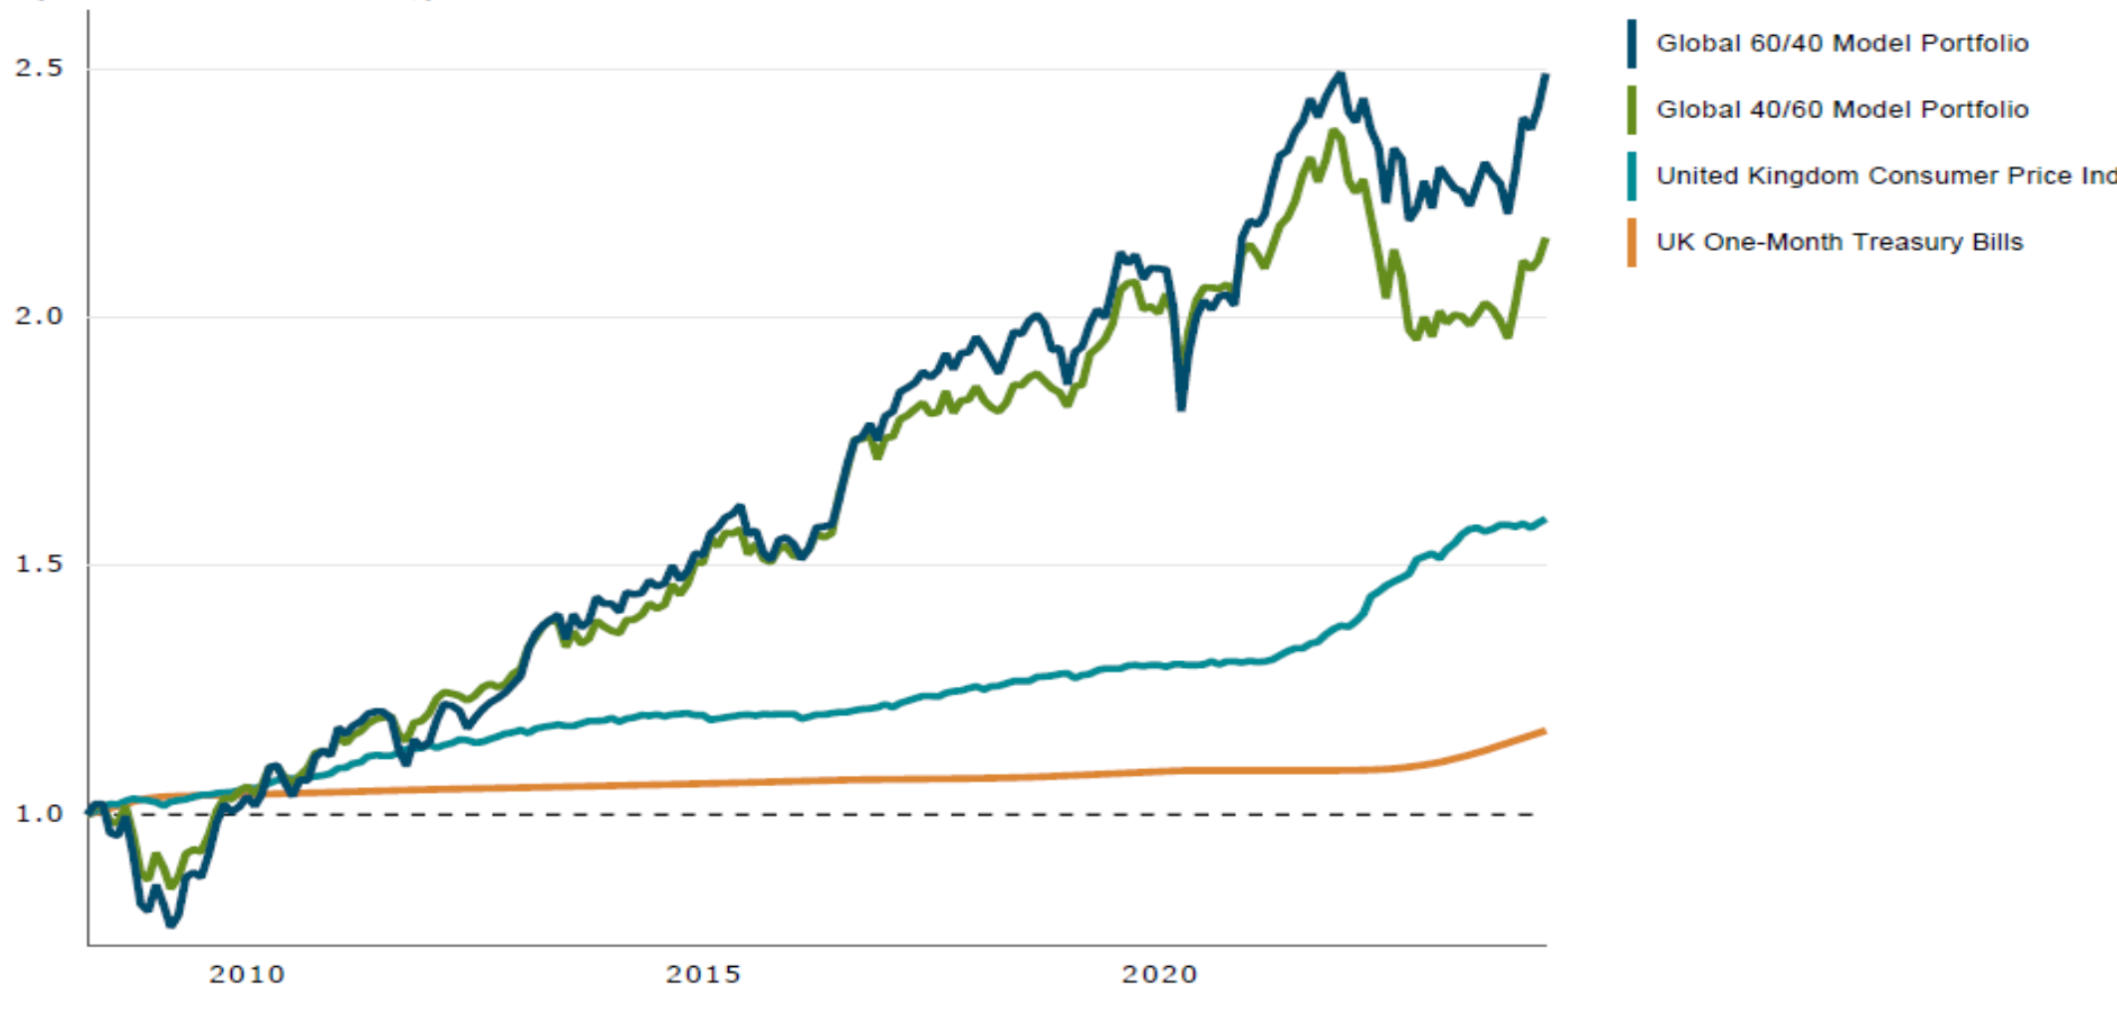
Portfolios should be diversified and structured for different objectives through the asset allocation policy not built on a more speculative basis. Below is a demonstration of this via our Global 40/60 Model and Global 60/40 Model using index trackers:
Whitings Wealth Management Ltd • 12/13 The Crescent, Wisbech, Cambs, PE13 1EH. UK
Tel: 01945 581937 • info@whitingswm.co.uk
website design by finedesign.co.uk